Boosting (auditory) memory with (visual) stimulations
We often experience that disparate sensory perceptions can interfere with our ability to focus and perform actions – such as when loud music is playing on the radio while we try to park our car.
But our new study shows that visual stimulations can also entrain the brain and boost our memory of sound sequences. Hence, stimulating one of our senses can actually enhance our capacity to memorize inputs to our other senses.
The results, obtained in collaboration with the Zatorre lab, also at McGill’s Montreal Neurological Institute, are published today in open access in the journal Science Advances. Prof Philippe Albouy led the study when he was a NSERC Banting Post-Doctoral Fellow with Profs Baillet and Zatorre. He is now faculty at Université Laval.
We had shown in a previous study that manipulating items in working memory activated the rhythmic activity of a network of brain regions at a natural frequency of about 5 beats per second (5 Hz). We showed in that same study that stimulating one node of this network at the 5-Hz frequency with external magnetic fields, entrained the entire network at that frequency, and boosted our capacity to retain and manipulate auditory items in working memory.
In the new study, instead of external magnetic fields, we used flickering presentations of rotating abstract shapes. We used these visual forms because they are known to activate the same brain region in the parietal lobe that we had targeted in the previous study.
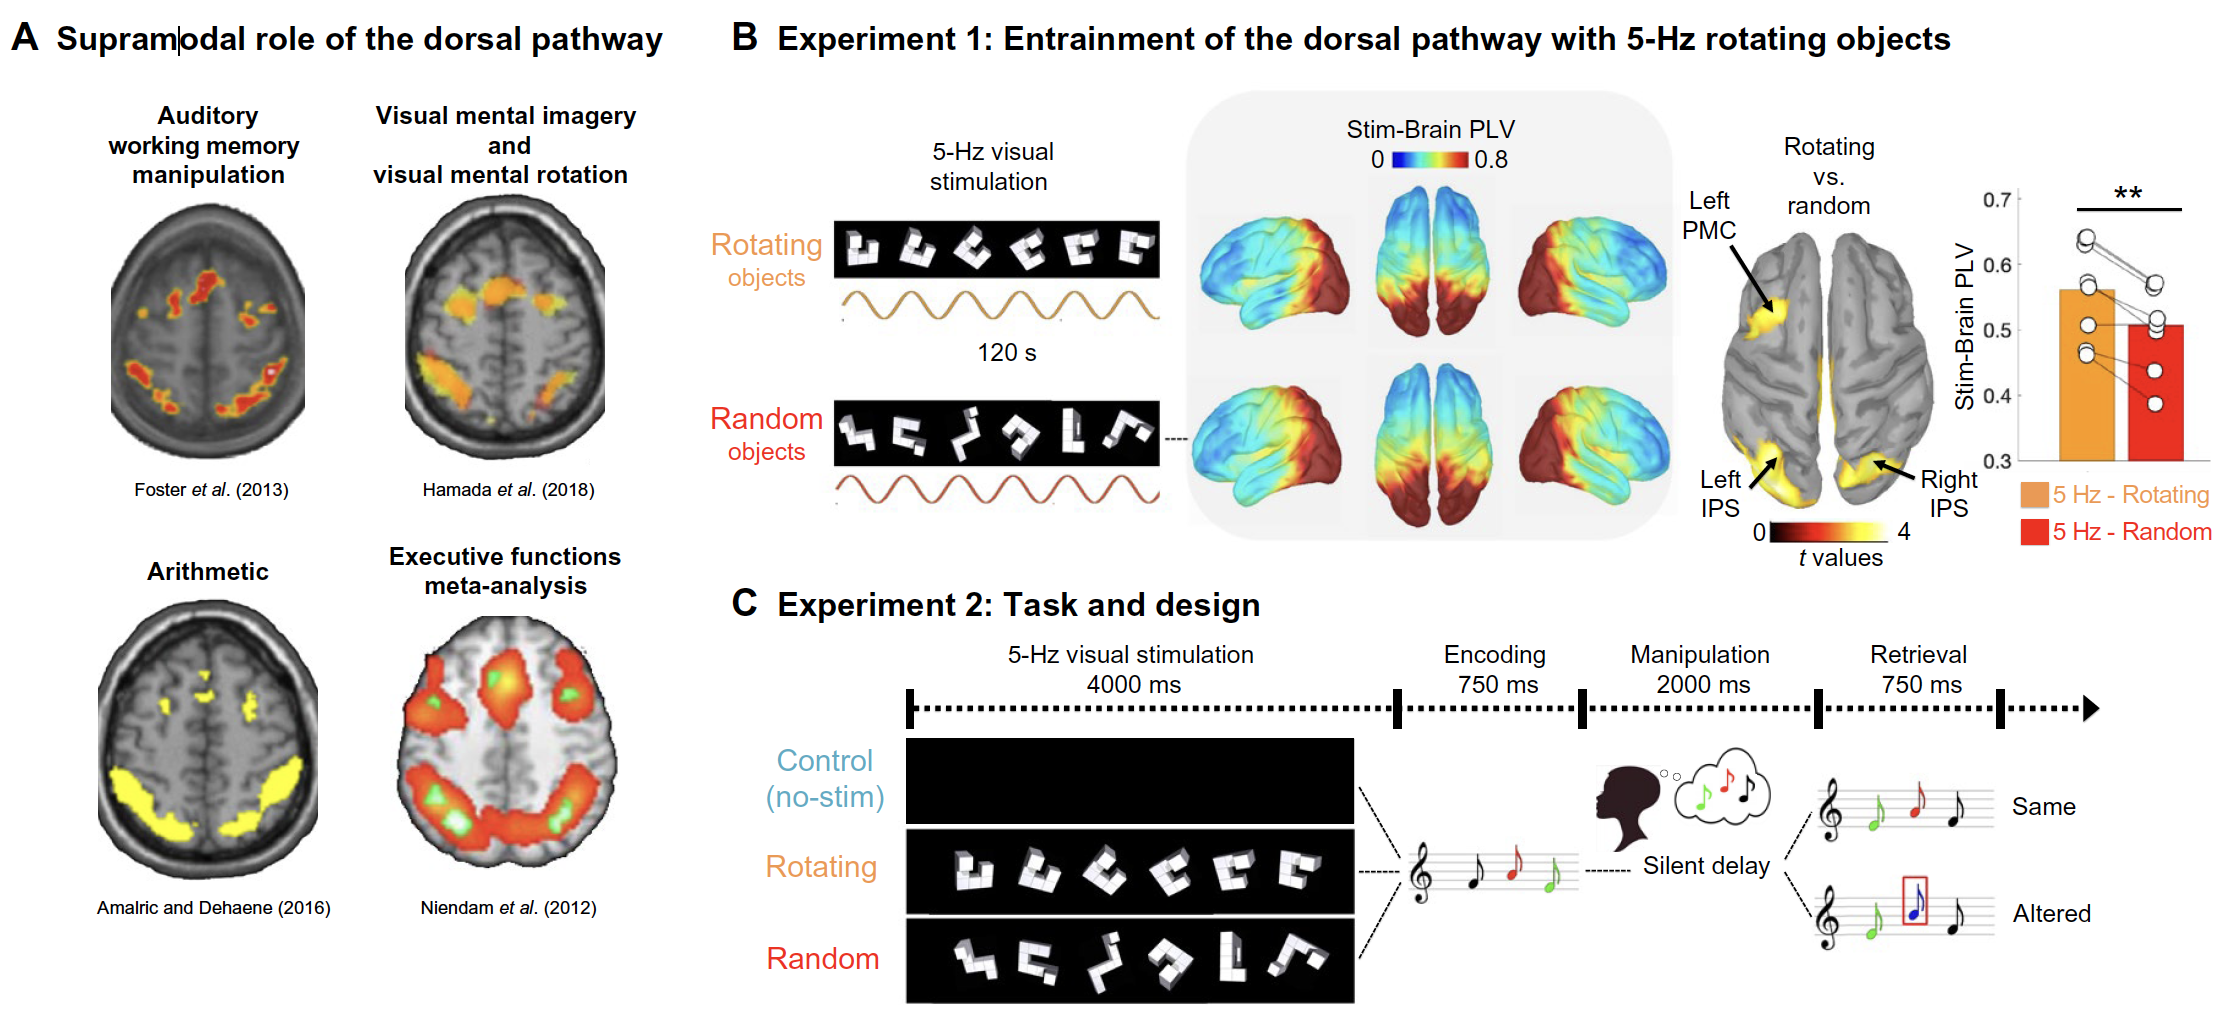
(A) Dorsal pathway brain regions are involved in a wide range of cognitive tasks, as illustrated from a selection of fMRI studies of auditory working memory (23), visual mental imagery and rotation (24), and arithmetic (28) and executive functioning (22) (see the Supplementary Materials for details). (B) Experiment 1: In each trial, participants passively observed either the same rotating Shepard’s object (26) or a random selection of Shepard’s objects (in both cases, 120-s stimulation duration and flickering at 5 Hz). Left: Stim-Brain PLV scores at 5 Hz were extracted for each of the MEG cortical sources. Right: Rotating versus random Stim-Brain PLV contrast revealed dorsal stream regions (P < 0.05 uncorrected for illustration). Bar plot shows Stim-Brain PLV (average of significant regions: left IPS, right IPS, and left PMC) for the rotating (orange) and random (red) conditions. White dots represent individual data; all participants showed the effect (eight of eight). (C) Experiment 2: Participants performed an auditory working memory task under three conditions: (i) without visual stimulation [control condition (no-stim), top panel], (ii) after presentation of 5-Hz rhythmic visual stimulation (rotating, middle panel), and (iii) after presentation of random shapes (random, bottom panel) over the first 4 s of each trial. They then listened to a three-note melody and had to mentally reverse the sequence over the next 2 s. In “same” trials, the second auditory sequence consisted of the same tones as in the first melody but in reversed temporal order; in “different” trials, the melody was also reversed, but the pitch of one of the tones was different than in the original sequence.
We used magnetoencephalography (MEG) millisecond brain imaging to show that these visual stimulations indeed entrained the targeted region and the network of connected brain regions involved in working memory. Importantly, participants performed better in an auditory working memory task when this network was entrained by the visual stimulation at the onset of each working memory trial, thereby demonstrating for the first time, a form of transfer between the senses that boosts brain functions. More technically, the study provides causal evidence that the targeted frontoparietal brain network plays a supramodal role in human cognition, which means it supports a variety of functions independently of the nature (i.e., auditory, visual, etc.) of its inputs.
(A) EEG data of the control (no-stim) condition. Top: EEG topography (center display, averaged over the significant 1000- to 1250-ms time window, cluster-corrected P < 0.05) and time-frequency representation (left and right displays, for a trial time window: 0 to 3500 ms) of correlation scores (R values) between the power of EEG signals shown at representative electrodes P7 and P8, and behavioral performance. Bottom: Whole-brain correlation between behavioral performance and theta band signal power (Hilbert transform in the theta band 4 to 8 Hz, averaged over the significant 1000- to 1250-ms time window) at the source level (P < 0.05, cluster-corrected). Scatter plots of performance in the control (no-stim) condition against theta power in the left and right IPS. (B) Whole-brain correlation (P < 0.05, cluster-corrected) between theta PLV with bilateral IPS during the manipulation period (750 to 2750 ms) and behavioral performance in the control (no-stim) condition. Scatter plot of performance in the control (no-stim) condition against theta PLV (seed bilateral IPS) in the left PMC.
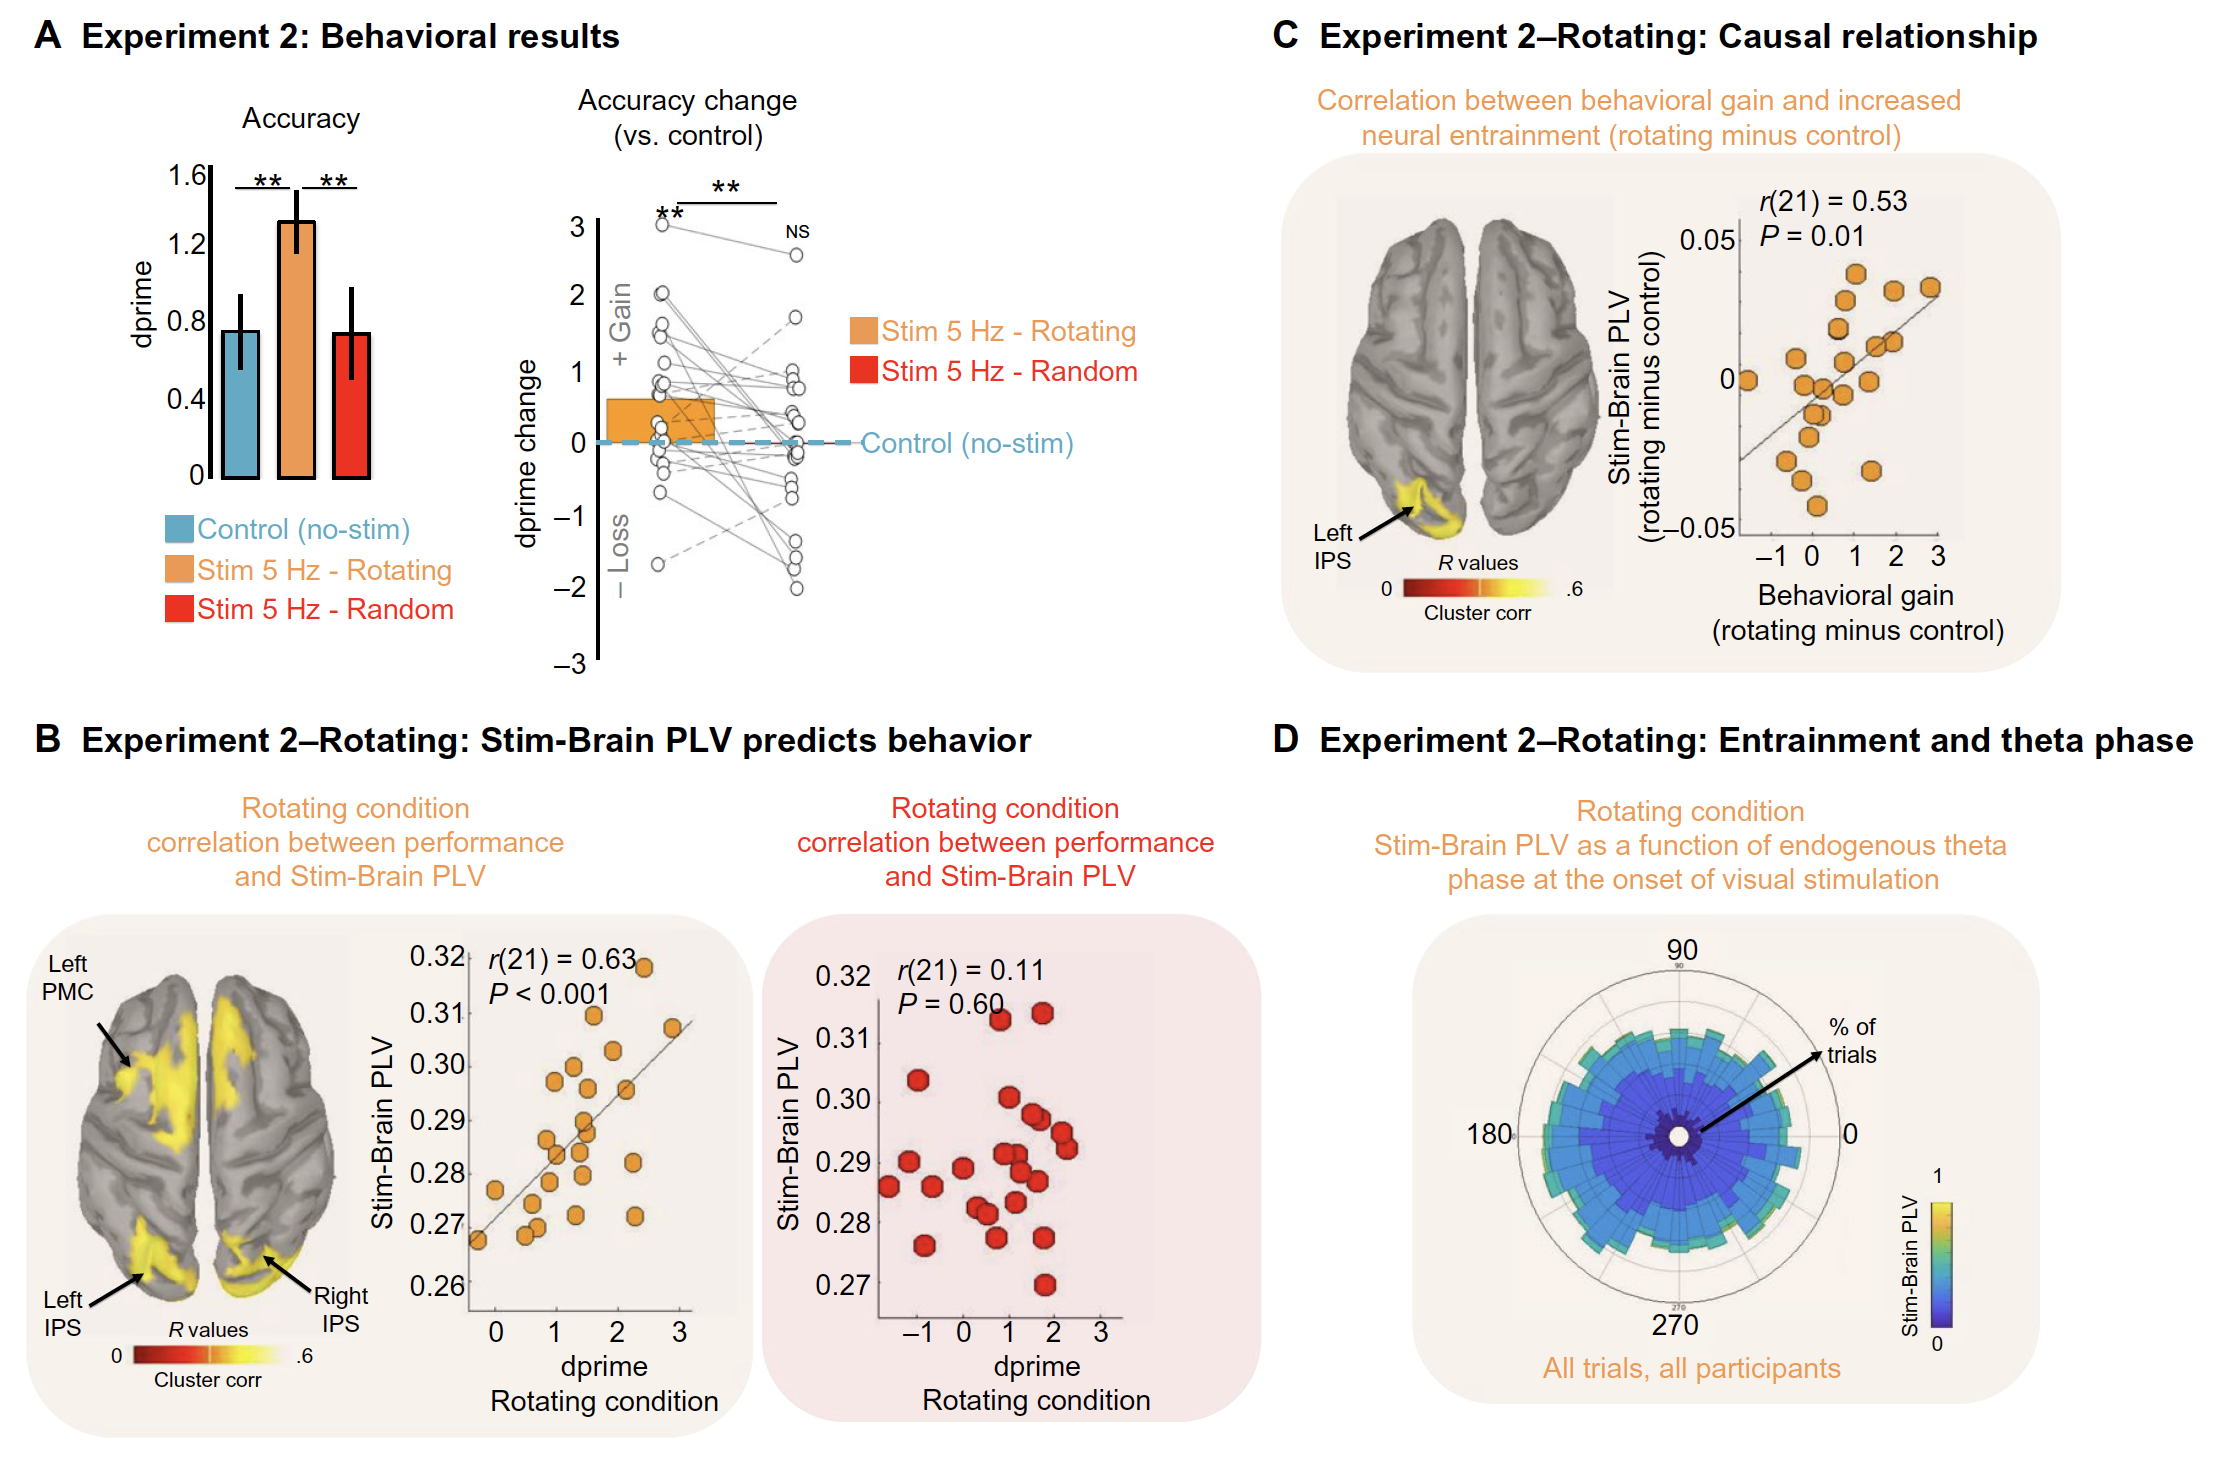
(A) Left: Mean performance (dprime) on the auditory working memory task for the control condition (blue), the rhythmic visual simulation with rotating objects (orange), and the rhythmic visual simulation with random objects (red). Error bars indicate SEM. Stars indicate significance (all P < 0.02). Right: Changes in task performance accuracy in the rotating and random visual presentation conditions relative to the control condition (positive values represent a gain in task performance; negative values represent a loss in task performance). Dots indicate individual data. Solid lines indicate participants who showed increased performance in the rotating versus random condition (15 of 23). Dashed lines indicate participants showing decreased performance for the same comparison (8 of 23). NS, not significant. (B) Left: Whole-brain correlation at the source level between behavioral performance and 5-Hz Stim-Brain PLV for the rotating condition (P < 0.05, cluster-corrected). Middle: Scatter plot of performance for the rotating condition against Stim-Brain theta PLV (average of bilateral IPS and left PMC). Right: Scatter plot of performance (average of bilateral IPS and left PMC identified in the rotating condition) for the random condition against Stim-Brain theta PLV. (C) Whole-brain correlation (P < 0.05, cluster-corrected) and scatter plots of behavioral benefits (versus control) against Stim-Brain PLV entrainment (versus control) for the rotating condition. (D) Stim-Brain PLV as a function of theta phase at visual stimulation onset. The circular histogram, across participants and trials, represents the theta phases measured in bilateral IPS and left PMC. Color map represents the strength of Stim-Brain PLV.
(A) Experiment 3: Participants performed the auditory working memory task described in experiment 2 under four conditions: (i) without visual stimulation [control condition (no-stim), in blue], (ii) after presentation of a 5-Hz rhythmic rotating visual stimulation as in experiment 2 (5Hz-rotating, in orange), (iii) after presentation of a continuously rotating visual stimulation (continuous-rotating, in light green), and (iv) after presentation of a 1-Hz rhythmic rotating visual stimulation (1Hz-rotating, in dark green) over the first 4 s of each trial. (B) Performance (dprime) on the auditory working memory task for the control condition (blue), the 5-Hz rhythmic visual simulation with rotating objects (orange), the continuous-rotating visual simulation (light green), and the 1-Hz rhythmic visual simulation with rotating objects (dark green). Error bars indicate SEM. Stars indicate significance (all P < 0.05). Right: Changes in task performance accuracy in the 5Hz-rotating, continuous-rotating, and 1Hz-rotating visual presentation conditions relative to the control condition (positive values represent a gain in task performance; negative values represent a loss in task performance). Dots indicate individual data. Solid lines indicate participants who showed increased performance (relative to control) in the rotating versus continuous and versus 1-Hz condition (11 of 12). Dashed lines indicate participants showing decreased performance for the same comparison (1 of 12).
Importantly, the benefits in terms of working memory performance were only achieved when the images were flickered 5 times per second specifically, and not when presented at a different rate (1Hz) or continuously.
Our study provides evidence that targeted rhythmic entrainment of a supramodal brain network by sensory modality can be beneficial to the performance of a cognitive task in another modality. Whether such benefits can be long lasting remains to be studied.
Future research will also show whether this approach can be extended and generalized to interventions on other brain systems and sensory modalities and whether this procedure can inspire a practical approach to transfer of learning in general, with potential for translational and clinical impact.
From the paper — The frontoparietal network is involved in multiple cognitive tasks, such as visual mental rotation, working memory, or arithmetic. However, whether those different cognitive processes are supported by the same supramodal network or by distinct, but overlapping, functional systems is still unresolved. We investigate whether frontoparietal activity can be selectively entrained by a rhythmic sensory stimulus (visual rotation) and whether this entrainment can causally modulate performance in another task and modality (auditory memory). We show that rhythmic visual presentations of rotating shapes, known to activate the dorsal pathway, increase frontoparietal connectivity at stimulation frequency. We then show that frontoparietal theta oscillations predict auditory working memory performance. Last, we demonstrate that theta rhythmic visual stimulation applied during auditory memory causally enhances performance, and both the rotating properties of the stimulus and its flickering frequency drive the effect. This study provides causal evidence of the supramodal role of the frontoparietal network in human cognition.
Read the full article here.


